Tuscan Catalog
Welcome to the catalog!
Tuscan is a tool for testing the portability of programs at large scale. The source code is available on GitHub, and the tool and experiment are described in a paper by Kareem Khazem, Earl T. Barr, and Petr Hosek. This site shows the results of a run of Tuscan over four toolchains.
Quick-start
Click on a filter in the menu on the left to start browsing the catalog. The manual below describes how to use the catalog.
Tuscan Catalog Manual
There are three areas of the catalog: build lists, build details, and process trees.
Build lists
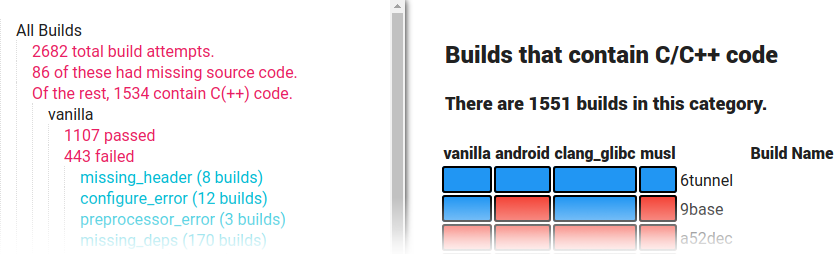
Build lists summarize the build results for a large number of packages that fulfil a certain criterion. The list of packages is on the right; the name of a package is given next to all the platforms it was built with. A red box indicates a failed build; a blue box indicates a successful one. Some build pages have a brief summary of why the build failed next to the package name. For example, this page gives a summary of the unrecognised compiler flags when compiling with the Clang/Musl platform, both for each package and for all 4 packages that failed because of this error.
The categories on the left are filters; sub-lists of each hyperlink accumulate the filters. For example, in the diagram above, there are 12 builds that failed due to a configure error, out of the 433 builds that failed on the vanilla platform, out of 1534 C/C++ programs. Clicking on configure_error (12 builds) in the menu opens a build list containing only those 12 builds. Builds that failed due to a configure error but under the android or musl platform would be under a different link, further down.
| y | y | In the build list, these boxes are hyperlinks. They take you to the detailed build page for that package under that platform, so that you can examine how the build proceeded and understand why a build failed under that particular platform. |
Build pages
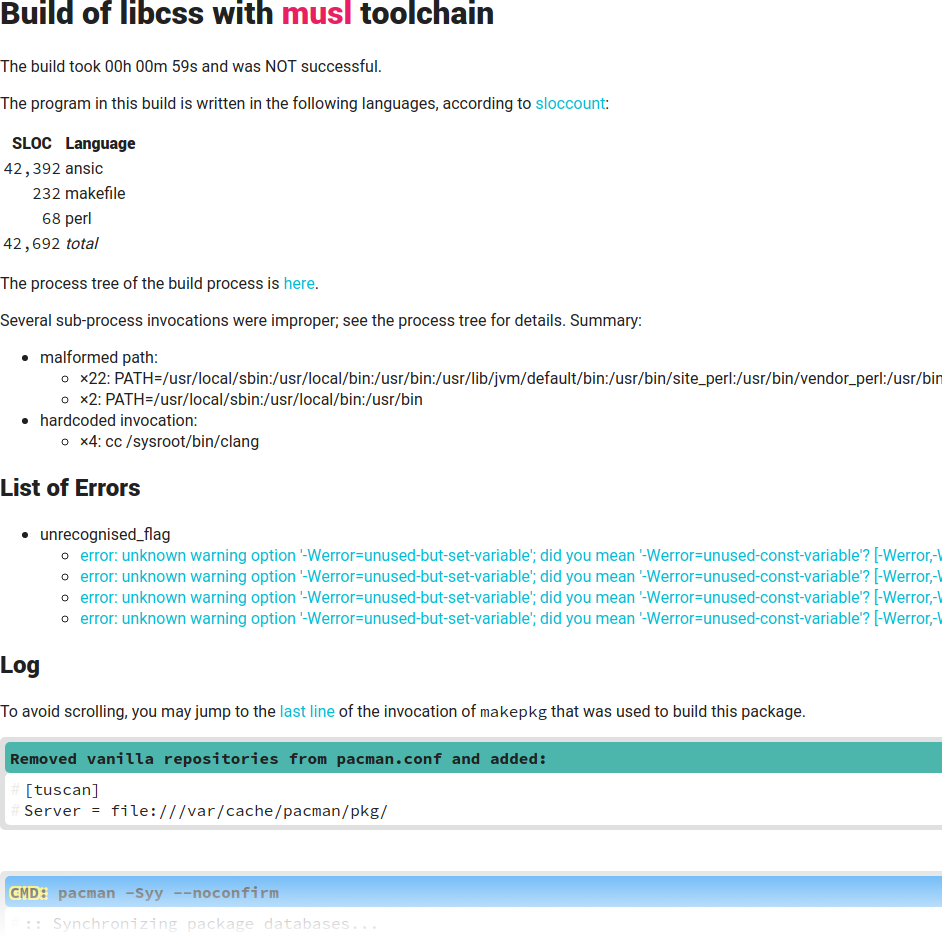
Build pages log the entire build process of a single package under a single platform. There are several interesting features of a build page:
-
Red may have
partially or fully rescued the build. If there were build errors
that Red fixed,
they are listed with details, like this:
- Any lines of the log that indicate that a build error occurred are highlighted in strong red, to help when scrolling through long logs.
- For your convenience, every line of the log can be linked to; click the hash symbol (#) at the beginning of a log line to get a hyperlink URL.
- The build page contains a link to the process tree for that build, for an extremely detailed view of what went wrong with the build.
Process Trees
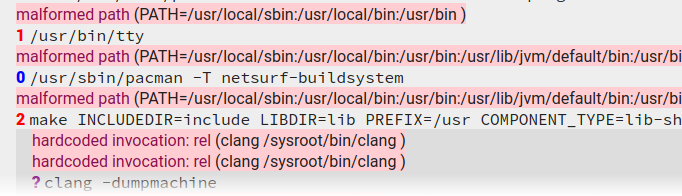
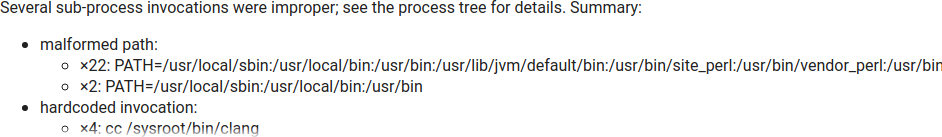
Process trees show all of the tools that were invoked during the build, their return codes, and command-line arguments. They are arranged in a tree, since some build tools invoke others as subprocesses. This information is all obtained by Red, which injects logging information into every process spawn.
Every time a subprocess is spawned, Red may notice that the environment or process
invocation is likely to cause the build to fail, according to its
built-in patterns. If this happens, Red modifies the environment, invocation, or
argv so that the build can proceed correctly. Such
erroneous invocations are indicated with a red
background in the process log.